And now, in a break from the previous trend of fluffy posts, we have a tutorial on how to (deep breath): connect PHP to a MSSQL Server 2008 instance over ODBC from Ubuntu Linux using the FreeTDS driver and unixODBC. Theoretically it would also work for SQL Server 2005.
I don’t know whether half of the settings flags are necessary or even correct, but what follows Worked for Me™, YMMV, etc, etc.
In the commands below, I’ll use 192.168.0.1 as the server housing the SQL Server instance, with a SQL Server user name of devuser, password devpass. I’m assuming SQL Server is set up to listen on its default port, 1433. Keep an eye out, because you’ll need to change these things to your own settings.
First, install unixODBC:
sudo apt-get install unixodbc unixodbc-dev
I also installed the following (perhaps necessary) packages: sudo apt-get install tdsodbc php5-odbc
Then download, untar, compile, and install FreeTDS (warning, the URL may change): cd /usr/local
wget http://ibiblio.org/pub/Linux/ALPHA/freetds/stable/freetds-stable.tgz
tar xvfz freetds-stable.tgz
cd freetds-0.82
./configure --enable-msdblib --with-tdsver=8.0 --with-unixodbc=/usr
make
make install
make clean
Attempt a connection over Telnet to your SQL Server instance: telnet 192.168.0.1 1433
Use the tsql tool to test out the connection: tsql -S 192.168.0.1 -U devuser
This should prompt you for the password, after which you can hope against hope to see this beautiful sign: 1>
If that worked, I recommend throwing a (coding) party. Next up is some configging. Open the FreeTDS config file. /usr/local/etc/freetds.conf
Add the following entry to the bottom of the file. We’re setting up a datasource name (DSN) called ‘MSSQL’. [MSSQL]
host = 192.168.0.1
port = 1433
tds version = 8.0
Now open the ODBC configuration file: /usr/local/etc/odbcinst.ini
And add the following MSSQL driver entry (FreeTDS) at the end: [FreeTDS]
Description = FreeTDS driver
Driver = /usr/local/lib/libtdsodbc.so
Setup=/usr/lib/odbc/libtdsS.so
FileUsage = 1
UsageCount = 1
Then, finally, set up the DSN within ODBC in the odbc.ini file here /usr/local/etc/odbc.ini
By adding this bit to the file: [MSSQL]
Description = MS SQL Server
Driver = /usr/local/lib/libtdsodbc.so
Server = 192.168.2.3
UID = devuser
PWD = devpass
ReadOnly = No
Port = 1433
Test out the connection using the isql tool: isql -v MSSQL devuser 'devpass'
If you see “Connected!” you’re golden, congratulations! If not, I’m truly sorry; see below where there are some resources that might help.
Now restart Apache and test it from PHP using ‘MSSQL’ as the DSN. If something doesn’t work, you might try installing any or all of these packages: mdbtools libmdbodbc libmdbtools mdbtools-gmdb
Here are some other resources that were helpful to me through this disastrous journey.
The OS X Terminal opens up a world of powerful UNIX utilities and scripts. If you’re migrating from Linux, you’ll find many familiar commands work the way you expect. But power users often aren’t aware that OS X comes with a number of its own text-based utilities not found on any other operating system. Learning about these Mac-only programs can make you more productive on the command line and help you bridge the gap between UNIX and your Mac.
Update: Thanks to reader feedback, I’ve written about a few more commands in a follow-up post: (And eight hundred more).
1. open
open opens files, directories and applications. Exciting, right? But it really does come in handy as a command-line double-click. For instance, typing:
$ open /Applications/Safari.app/
…will launch Safari as if you had double-clicked its icon in the Finder.
If you point open at a file instead, it will try to load the file with its associated GUI application. open screenshot.png on an image will open that image in Preview. You can set the -a flag to choose the app yourself, or -e to open the file for editing in TextEdit.
Running open on a directory will take you straight to that directory in a Finder window. This is especially useful for bringing up the current directory by typing open .
Remember that the integration between Finder and Terminal goes both ways – if you drag a file from Finder into a Terminal window, its full path gets pasted into the command line.
2. pbcopy and pbpaste
These two commands let you copy and paste text from the command line. Of course, you could also just use your mouse—but the real power of pbcopy and pbpaste comes from the fact that they’re UNIX commands, and that means they benefit from piping, redirection, and the ability to be in scripts in conjunction with other commands. Typing:
$ ls ~ | pbcopy
…will copy a list of files in your home directory to the OS X clipboard. You can easily capture the contents of a file:
$ pbcopy < blogpost.txt
..or do something crazier. This hacked-up script will grab the link of the latest Google doodle and copy it to your clipboard.
Using pbcopy with pipes is a great way to capture the output of a command without having to scroll up and carefully select it. This makes it easy to share diagnostic information. pbcopy and pbpaste can also be used to automate or speed up certain kinds of tasks. For instance, if you want to save email subject lines to a task list, you could copy the subjects from Mail.app and run:
$ pbpaste >> tasklist.txt
3. mdfind
Many a Linux power user has tried to use locate to search for files on a Mac and then quickly discovered that it didn’t work. There’s always the venerable UNIX find command, but OS X comes with its own killer search tool: Spotlight. So why not tap into its power from the command line?
That’s exactly what mdfind does. Anything Spotlight can find, mdfind can find too. That includes the ability to search inside files and metadata.
mdfind comes with a few conveniences that make it stand out from its big blue brother. For instance, the -onlyin flag can restrict the search to a single directory:
$ mdfind -onlyin ~/Documents essay
The mdfind database should stay up to date in the background, but you can also troubleshoot it (as well as Spotlight) using mdutil. If Spotlight isn’t working the way it should, mdutil -E will erase the index and rebuild it from scratch. You can also turn off indexing entirely with mdutil -i off.
4. screencapture
screencapture lets you take many different kinds of screenshots. It’s similar to Grab.app and the keyboard shortcuts cmd + shift + 3 and cmd + shift + 4, except it’s far more flexible. Here are just a few different ways you can use screencapture:
Capture the contents of the screen, including the cursor, and attach the resulting image (named ‘image.png’) to a new Mail message:
$ screencapture -C -M image.png
Select a window using your mouse, then capture its contents without the window’s drop shadow and copy the image to the clipboard:
$ screencapture -c -W
Capture the screen after a delay of 10 seconds and then open the new image in Preview:
$ screencapture -T10 -P image.png
Select a portion of the screen with your mouse, capture its contents, and save the image as a pdf:
$ screencapture -s -t pdf image.pdf
To see more options, type screencapture --help
5. launchctl
launchctl lets you interact with the OS X init script system, launchd. With launch daemons and launch agents, you can control the services that start up when you boot your computer. You can even set up scripts to run periodically or at timed intervals in the background, similar to cron jobs on Linux.
For example, if you’d like to have the Apache web server start automatically when you turn on your Mac, simply type:
Running launchctl list will show you what launch scripts are currently loaded. sudo launchctl unload [path/to/script] will stop and unload running scripts, and adding the -w flag will remove those scripts permanently from your boot sequence. I like to run this one on all the auto-update “helpers” created by Adobe apps and Microsoft Office.
Launchd scripts are stored in the folllowing locations:
To see what goes into a launch agent or daemon, there’s a great blog post by Paul Annesley that walks you through the file format. And if you’d like to learn how to write your own launchd scripts, Apple provides some helpful documentation on their Developer site. There’s also the fantastic Lingon app if you’d prefer to avoid the command line entirely.
6. say
This is a fun one: say converts text to speech, using the same TTS engine OS X uses for VoiceOver. Without any options, say will simply speak whatever text you give it out loud.:
$ say "Never trust a computer you can't lift."
You can also use say to speak the contents of a text file with the -f flag, and you can store the resulting audio clip with the -o flag:
$ say -f mynovel.txt -o myaudiobook.aiff
The say command can be useful in place of console logging or alert sounds in scripts. For instance, you can set up an Automator or Hazel script to do batch file processing and then announce the task’s completion with say.
But the most enjoyable use for say is rather more sinister: if you have ssh access to a friend or coworker’s Mac, you can silently log into their machine and haunt them through the command line. Give ‘em a Siri-ous surprise.
You can set the voice (and language!) used by say by changing the default setting in the Dictation & Speech panel in System Preferences.
7. diskutil
diskutil is a command line interface to the Disk Utility app that comes with OS X. It can do everything its graphical cousin can, but it also has some extra capabilities—such as filling a disk with zeroes or random data. Simply type diskutil list to see the path names of disks and removable media attached to your machine, and then point the command at the volume you want to operate on. Be careful: diskutil can permanently destroy data if it’s used incorrectly.
8. brew
Alright–this isn’t technically a native command. But no OS X power user should be without Homebrew. The website calls it “The missing package manager for OS X,” and that couldn’t be truer. If you’ve ever used apt-get in Linux, you will feel right at home in Homebrew.
brew gives you easy access to thousands of free utilities and libraries from the open source community. For instance, brew install imagemagick will set you up with ImageMagick, a powerful utility that makes it possible to do anything from whipping up animated gifs to converting images between dozens of different types. brew install node will introduce you to NodeJS, the hot new tool for developing and running server-side JavaScript apps.
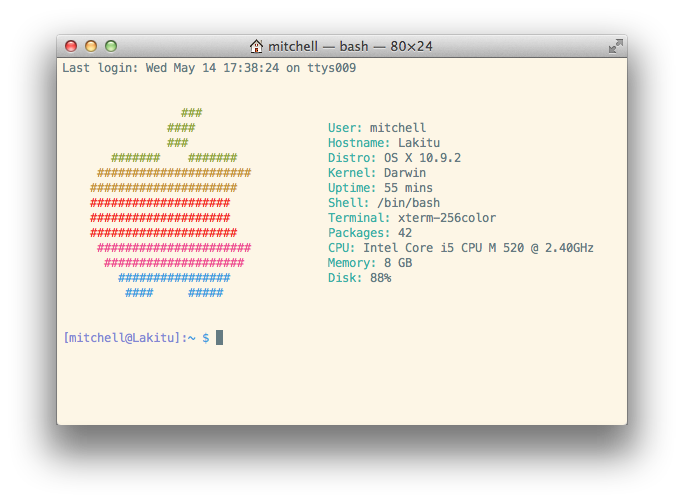
You can have fun with Homebrew too: brew install archey will get you Archey, a cool little script for displaying your Mac’s specs next to a colourful Apple logo. The selection in Homebrew is huge—and because it’s so easy to create formulas, new packages are being added all the time.
ARCHEY—My command line brings all the boys to the yard.
But the best part about Homebrew? It keeps all its files in a single directory: /usr/local/. That means you can install newer versions of system software, such as python and mysql, without interfering with the built-in equivalents. And if you ever want to get rid of your Homebrew installation, it’s easy to remove.
Edit—May 15: Someone suggested to me that that you should not blindly delete the contents of /usr/local/. That’s a fair precaution. To remove Homebrew safely, use the uninstall script.
By Jonathan Sundqvist, Engineer at Server Density.
Published on the 4th February, 2015.
The industry is hotting up at the moment, and there are more tools than you can shake a stick at. Here lies the most comprehensive list on the Internet (of monitoring tools). Featuring over 80 ways to monitor your machines. Within this article we outline:
Command line tools
Network related
System related monitoring
Log monitoring tools
Infrastructure monitoring tools
It’s hard work monitoring and debugging performance problems, but it’s easier with the right tools at the right time. But how much of your valuable time do you think it would take you to investigate all of these tools and find out which one is best for you?
Why not check out Server Density first, it has a beautiful UI, an api that’s easy to use and alerts that will keep downtime to a minimum.
Top 10 System Monitoring Tools
1. Top
This is a small tool which is pre-installed in many unix systems. When you want an overview of all the processes or threads running in the system: top is a good tool. You can order these processes on different criteria and the default criteria is CPU.
Htop is essentially an enhanced version of top. It’s easier to sort by processes. It’s visually easier to understand and has built in commands for common things you would like to do. Plus it’s fully interactive.
Atop monitors all processes much like top and htop, unlike top and htop however it has daily logging of the processes for long-term analysis. It also shows resource consumption by all processes. It will also highlight resources that have reached a critical load.
Apachetop monitors the overall performance of your apache webserver. It’s largely based on mytop. It displays current number of reads, writes and the overall number of requests processed.
ftptop gives you basic information of all the current ftp connections to your server such as the total amount of sessions, how many are uploading and downloading and who the client is.
mytop is a neat tool for monitoring threads and performance of mysql. It gives you a live look into the database and what queries it’s processing in real time.
powertop helps you diagnose issues that has to do with power consumption and power management. It can also help you experiment with power management settings to achieve the most efficient settings for your server. You switch tabs with the tab key.
iotop checks the I/O usage information and gives you a top-like interface to that. It displays columns on read and write and each row represents a process. It also displays the percentage of time the process spent while swapping in and while waiting on I/O.
ntopng is the next generation of ntop and the tool provides a graphical user interface via the browser for network monitoring. It can do stuff such as: geolocate hosts, get network traffic and show ip traffic distribution and analyze it.
iftop is similar to top, but instead of mainly checking for cpu usage it listens to network traffic on selected network interfaces and displays a table of current usage. It can be handy for answering questions such as “Why on earth is my internet connection so slow?!”.
jnettop visualises network traffic in much the same way as iftop does. It also supports customizable text output and a machine-friendly mode to support further analysis.
BandwidthD tracks usage of TCP/IP network subnets and visualises that in the browser by building a html page with graphs in png. There is a database driven system that supports searching, filtering, multiple sensors and custom reports.
EtherApe displays network traffic graphically, the more talkative the bigger the node. It either captures live traffic or can read it from a tcpdump. The displayed can also be refined using a network filter with pcap syntax.
ethtool is used for displaying and modifying some parameters of the network interface controllers. It can also be used to diagnose Ethernet devices and get more statistics from the devices.
NetHogs breaks down network traffic per protocol or per subnet. It then groups by process. So if there’s a surge in network traffic you can fire up NetHogs and see which process is causing it.
iptraf gathers a variety of metrics such as TCP connection packet and byte count, interface statistics and activity indicators, TCP/UDP traffic breakdowns and station packet and byte counts.
ngrep is grep but for the network layer. It’s pcap aware and will allow to specify extended regular or hexadecimal expressions to match against packets of .
MRTG was orginally developed to monitor router traffic, but now it’s able to monitor other network related things as well. It typically collects every five minutes and then generates a html page. It also has the capability of sending warning emails.
Bmon monitors and helps you debug networks. It captures network related statistics and presents it in human friendly way. You can also interact with bmon through curses or through scripting.
20. traceroute
Traceroute is a built-in tool for displaying the route and measuring the delay of packets across a network.
IPTState allows you to watch where traffic that crosses your iptables is going and then sort that by different criteria as you please. The tool also allows you to delete states from the table.
Darkstat captures network traffic and calculates statistics about usage. The reports are served over a simple HTTP server and gives you a nice graphical user interface of the graphs.
vnStat is a network traffic monitor that uses statistics provided by the kernel which ensures light use of system resources. The gathered statistics persists through system reboots. It has color options for the artistic sysadmins.
24. netstat
Netstat is a built-in tool that displays TCP network connections, routing tables and a number of network interfaces. It’s used to find problems in the network.
25. ss
Instead of using netstat, it’s however preferable to use ss. The ss command is capable of showing more information than netstat and is actually faster. If you want a summary statistics you can use the command ss -s.
Nmap allows you to scan your server for open ports or detect which OS is being used. But you could also use this for SQL injection vulnerabilities, network discovery and other means related to penetration testing.
MTR combines the functionality of traceroute and the ping tool into a single network diagnostic tool. When using the tool it will limit the number hops individual packets has to travel while also listening to their expiry. It then repeats this every second.
Tcpdump will output a description of the contents of the packet it just captured which matches the expression that you provided in the command. You can also save the this data for further analysis.
Justniffer is a tcp packet sniffer. You can choose whether you would like to collect low-level data or high-level data with this sniffer. It also allows you to generate logs in customizable way. You could for instance mimic the access log that apache has.
nmon either outputs the data on screen or saves it in a comma separated file. You can display CPU, memory, network, filesystems, top processes. The data can also be added to a RRD database for further analysis.
Conky monitors a plethora of different OS stats. It has support for IMAP and POP3 and even support for many popular music players! For the handy person you could extend it with your own scripts or programs using Lua.
Glances monitors your system and aims to present a maximum amount of information in a minimum amount of space. It has the capability to function in a client/server mode as well as monitoring remotely. It also has a web interface.
Saidar is a very small tool that gives you basic information about your system resources. It displays a full screen of the standard system resources. The emphasis for saidar is being as simple as possible.
RRDtool is a tool developed to handle round-robin databases or RRD. RRD aims to handle time-series data like CPU load, temperatures etc. This tool provides a way to extract RRD data in a graphical format.
Monit has the capability of sending you alerts as well as restarting services if they run into trouble. It’s possible to perform any type of check you could write a script for with monit and it has a web user interface to ease your eyes.
Linux process explorer is akin to the activity monitor for OSX or the windows equivalent. It aims to be more usable than top or ps. You can view each process and see how much memory usage or CPU it uses.
37. df
df is an abbreviation for disk free and is pre-installed program in all unix systems used to display the amount of available disk space for filesystems which the user have access to.
Dstat aims to be a replacement for vmstat, iostat, netstat and ifstat. It allows you to view all of your system resources in real-time. The data can then be exported into csv. Most importantly dstat allows for plugins and could thus be extended into areas not yet known to mankind.
SNMP is the protocol ‘simple network management protocol’ and the Net-SNMP tool suite helps you collect accurate information about your servers using this protocol.
Incron allows you to monitor a directory tree and then take action on those changes. If you wanted to copy files to directory ‘b’ once new files appeared in directory ‘a’ that’s exactly what incron does.
Monitorix is lightweight system monitoring tool. It helps you monitor a single machine and gives you a wealth of metrics. It also has a built-in HTTP server to view graphs and a reporting mechanism of all metrics.
44. vmstat
vmstat or virtual memory statistics is a small built-in tool that monitors and displays a summary about the memory in the machine.
45. uptime
This small command that quickly gives you information about how long the machine has been running, how many users currently are logged on and the system load average for the past 1, 5 and 15 minutes.
46. mpstat
mpstat is a built-in tool that monitors cpu usage. The most common command is using mpstat -P ALL which gives you the usage of all the cores. You can also get an interval update of the CPU usage.
47. pmap
pmap is a built-in tool that reports the memory map of a process. You can use this command to find out causes of memory bottlenecks.
48. ps
The ps command will give you an overview of all the current processes. You can easily select all processes using the command ps -A
sar is a part of the sysstat package and helps you to collect, report and save different system metrics. With different commands it will give you CPU, memory and I/O usage among other things.
Similar to sar collectl collects performance metrics for your machine. By default it shows cpu, network and disk stats but it collects a lot more. The difference to sar is collectl is able to deal with times below 1 second, it can be fed into a plotting tool directly and collectl monitors processes more extensively.
iostat is also part of the sysstat package. This command is used for monitoring system input/output. The reports themselves can be used to change system configurations to better balance input/output load between hard drives in your machine.
52. free
This is a built-in command that displays the total amount of free and used physical memory on your machine. It also displays the buffers used by the kernel at that given moment.
53. /Proc file system
The proc file system gives you a peek into kernel statistics. From these statistics you can get detailed information about the different hardware devices on your machine. Take a look at the full list of the proc file statistics
GKrellm is a gui application that monitor the status of your hardware such CPU, main memory, hard disks, network interfaces and many other things. It can also monitor and launch a mail reader of your choice.
Gnome system monitor is a basic system monitoring tool that has features looking at process dependencies from a tree view, kill or renice processes and graphs of all server metrics.
GoAccess is a real-time web log analyzer which analyzes the access log from either apache, nginx or amazon cloudfront. It’s also possible to output the data into HTML, JSON or CSV. It will give you general statistics, top visitors, 404s, geolocation and many other things.
Logwatch is a log analysis system. It parses through your system’s logs and creates a report analyzing the areas that you specify. It can give you daily reports with short digests of the activities taking place on your machine.
Much like Logwatch Swatch also monitors your logs, but instead of giving reports it watches for regular expression and notifies you via mail or the console when there is a match. It could be used for intruder detection for example.
MultiTail helps you monitor logfiles in multiple windows. You can merge two or more of these logfiles into one. It will also use colors to display the logfiles for easier reading with the help of regular expressions.
acct or psacct (depending on if you use apt-get or yum) allows you to monitor all the commands a users executes inside the system including CPU and memory time. Once installed you get that summary with the command ‘sa’.
Similar to acct this tool monitors users on your system and allows you to see in real time what commands and processes they are using. It gives you a tree structure of all the processes and so you can see exactly what’s happening.
strace is used to diagnose, debug and monitor interactions between processes. The most common thing to do is making strace print a list of system calls made by the program which is useful if the program does not behave as expected.
DTrace is the big brother of strace. It dynamically patches live running instructions with instrumentation code. This allows you to do in-depth performance analysis and troubleshooting. However, it’s not for the weak of heart as there is a 1200 book written on the topic.
Webmin is a web-based system administration tool. It removes the need to manually edit unix configuration files and lets you manage the system remotely if need be. It has a couple of monitoring modules that you can attach to it.
65. stat
Stat is a built-in tool for displaying status information of files and file systems. It will give you information such as when the file was modified, accessed or changed.
66. ifconfig
ifconfig is a built-in tool used to configure the network interfaces. Behind the scenes network monitor tools use ifconfig to set it into promiscuous mode to capture all packets. You can do it yourself with ifconfig eth0 promiscand return to normal mode with ifconfig eth0 -promisc.
ulimit is a built-in tool that monitors system resources and keeps a limit so any of the monitored resources don’t go overboard. For instance making a fork bomb where a properly configured ulimit is in place would be totally fine.
CPUlimit is a small tool that monitors and then limits the CPU usage of a process. It’s particularly useful to make batch jobs not eat up too many CPU cycles.
69. lshw
lshw is a small built-in tool extract detailed information about the hardware configuration of the machine. It can output everything from CPU version and speed to mainboard configuration.
70. w
W is a built-in command that displays information about the users currently using the machine and their processes.
71. lsof
lsof is a built-in tool that gives you a list of all open files and network connections. From there you can narrow it down to files opened by processes, based on the process name, by a specific user or perhaps kill all processes that belongs to a specific user.
Infrastructure monitoring tools
72. Server Density
Our linux monitoring tool! It has a web interface that allows you to set alerts and view graphs for all system and network metrics. You can also set up monitoring of websites whether they are up or down. Server Density allows you to set permissions for users and you can extend your monitoring with our plugin infrastructure or api. The service already supports Nagios plugins.
OpenNMS has four main functional areas: event management and notifications; discovery and provisioning; service monitoring and data collection. It’s designed to be customizable to work in a variety of network environments.
SysUsage monitors your system continuously via Sar and other system commands. It also allows notifications to alarm you once a threshold is reached. SysUsage itself can be run from a centralized place where all the collected statistics are also being stored. It has a web interface where you can view all the stats.
brainypdm is a data management and monitoring tool that has the capability to gather data from nagios or another generic source to make graphs. It’s cross-platform, has custom graphs and is web based.
PCP has the capability of collating metrics from multiple hosts and does so efficiently. It also has a plugin framework so you can make it collect specific metrics that is important to you. You can access graph data through either a web interface or a GUI. Good for monitoring large systems.
This tool is both a system monitor and task manager. You can view server metrics from several machines through the worksheet and if a process needs to be killed or if you need to start a process it can be done within KDE system guard.
Munin is both a network and a system monitoring tool which offers alerts for when metrics go beyond a given threshold. It uses RRDtool to create the graphs and it has web interface to display these graphs. Its emphasis is on plug and play capabilities with a number of plugins available.
Nagios is system and network monitoring tool that helps you monitor monitor your many servers. It has support for alerting for when things go wrong. It also has many plugins written for the platform.
Zenoss provides a web interface that allows you to monitor all system and network metrics. Moreover it discovers network resources and changes in network configurations. It has alerts for you to take action on and it supports the Nagios plugins.
(And one for luck!) Cacti is network graphing solution that uses the RRDtool data storage. It allows a user to poll services at predetermined intervals and graph the result. Cacti can be extended to monitor a source of your choice through shell scripts.
Zabbix is an open source infrastructure monitoring solution. It can use most databases out there to store the monitoring statistics. The Core is written in C and has a frontend in PHP. If you don’t like installing an agent, Zabbix might be an option for you.
Bonus section:
Thanks for your suggestions. It’s an oversight on our part that we’ll have to go back trough and renumber all the headings. In light of that, here’s a short section at the end for some of the Linux monitoring tools recommended by you:
Collectd is a Unix daemon that collects all your monitoring statistics. It uses a modular design and plugins to fill in any niche monitoring. This way collectd stays as lightweight and customizable as possible.
Observium is an auto-discovering network monitoring platform supporting a wide range of hardware platforms and operating systems. Observium focuses on providing a beautiful and powerful yet simple and intuitive interface to the health and status of your network.
85. Nload
It’s a command line tool that monitors network throughput. It’s neat because it visualizes the in and and outgoing traffic using two graphs and some additional useful data like total amount of transferred data. You can install it with
SmokePing keeps track of the network latencies of your network and it visualises them too. There are a wide range of latency measurement plugins developed for SmokePing. If a GUI is important to you it’s there is an ongoing development to make that happen.
If you’re working in windows environment day in and day out. You may feel limited by the terminal Windows provides. MobaXterm comes to the rescue and allows you to use many of the terminal commands commonly found in Linux. Which will help you tremendously in your monitoring needs!
Shinken is a monitoring framework which is a total rewrite of Nagios in python. It aims to enhance flexibility and managing a large environment. While still keeping all your nagios configuration and plugins.
let words = ["Swift","iOS","cocoa","OSX","tvOS"]
let tweet = "This is an example tweet larking about Swift"

let valid = !words.filter({tweet.containsString($0)}).isEmpty
valid //true
let path = NSBundle.mainBundle().pathForResource("test", ofType: "txt")

let lines = try? String(contentsOfFile: path!).characters.split{$0 == "\n"}.map(String.init)
if let lines=lines {
    lines[0] // O! for a Muse of fire, that would ascend
    lines[1] // The brightest heaven of invention!
    lines[2] // A kingdom for a stage, princes to act
    lines[3] // And monarchs to behold the swelling scene.
}
map和字符串构造函数的最后一步把我们的数组字符转换为字符串。
5 祝你生日快乐!
这将显示生日快乐歌到控制台,通过map以及范围和三元运算符的简单使用。
let name = "uraimo"
(1...4).forEach{print("Happy Birthday " + (($0 == 3) ? "dear \(name)":"to You"))}
extension SequenceType{
    typealias Element = Self.Generator.Element

    func partitionBy(fu: (Element)->Bool)->([Element],[Element]){
        var first=[Element]()
        var second=[Element]()
        for el in self {
            if fu(el) {
                first.append(el)
            }else{
                second.append(el)
            }
        }
        return (first,second)
    }
}

let part = [82, 58, 76, 49, 88, 90].partitionBy{$0 < 60}
part // ([58, 49], [82, 76, 88, 90])
let xmlDoc = try? AEXMLDocument(xmlData: NSData(contentsOfURL: NSURL(string:"https://www.ibiblio.org/xml/examples/shakespeare/hen_v.xml")!)!)

if let xmlDoc=xmlDoc {
    var prologue = xmlDoc.root.children[6]["PROLOGUE"]["SPEECH"]
    prologue.children[1].stringValue // Now all the youth of England are on fire,
    prologue.children[2].stringValue // And silken dalliance in the wardrobe lies:
    prologue.children[3].stringValue // Now thrive the armourers, and honour's thought
    prologue.children[4].stringValue // Reigns solely in the breast of every man:
    prologue.children[5].stringValue // They sell the pasture now to buy the horse,
}
//Find the minimum of an array of Ints
[10,-22,753,55,137,-1,-279,1034,77].sort().first
[10,-22,753,55,137,-1,-279,1034,77].reduce(Int.max, combine: min)
[10,-22,753,55,137,-1,-279,1034,77].minElement()

//Find the maximum of an array of Ints
[10,-22,753,55,137,-1,-279,1034,77].sort().last
[10,-22,753,55,137,-1,-279,1034,77].reduce(Int.min, combine: max)
[10,-22,753,55,137,-1,-279,1034,77].maxElement()
select * from
(
select name,class,s,rank()over(partition by class order by s desc) mm from t2
)
where mm=1;
得到的结果是:
dss 1 95 1
ffd 1 95 1
gds 2 92 1
gf 3 99 1
ddd 3 99 1
注意:
1.在求第一名成绩的时候,不能用row_number(),因为如果同班有两个并列第一,row_number()只返回一个结果;
select * from
(
select name,class,s,row_number()over(partition by class order by s desc) mm from t2
)
where mm=1;
1 95 1 –95有两名但是只显示一个
2 92 1
3 99 1 –99有两名但也只显示一个
2.rank()和dense_rank()可以将所有的都查找出来:
如上可以看到采用rank可以将并列第一名的都查找出来;
rank()和dense_rank()区别:
–rank()是跳跃排序,有两个第二名时接下来就是第四名;
select name,class,s,rank()over(partition by class order by s desc) mm from t2
dss 1 95 1
ffd 1 95 1
fda 1 80 3 –直接就跳到了第三
gds 2 92 1
cfe 2 74 2
gf 3 99 1
ddd 3 99 1
3dd 3 78 3
asdf 3 55 4
adf 3 45 5
–dense_rank()l是连续排序,有两个第二名时仍然跟着第三名
select name,class,s,dense_rank()over(partition by class order by s desc) mm from t2
dss 1 95 1
ffd 1 95 1
fda 1 80 2 –连续排序(仍为2)
gds 2 92 1
cfe 2 74 2
gf 3 99 1
ddd 3 99 1
3dd 3 78 2
asdf 3 55 3
adf 3 45 4
–sum()over()的使用
select name,class,s, sum(s)over(partition by class order by s desc) mm from t2 –根据班级进行分数求和
dss 1 95 190 –由于两个95都是第一名,所以累加时是两个第一名的相加
ffd 1 95 190
fda 1 80 270 –第一名加上第二名的
gds 2 92 92
cfe 2 74 166
gf 3 99 198
ddd 3 99 198
3dd 3 78 276
asdf 3 55 331
adf 3 45 376
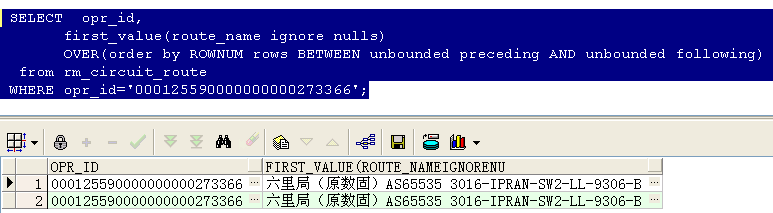
first_value() over()和last_value() over()的使用
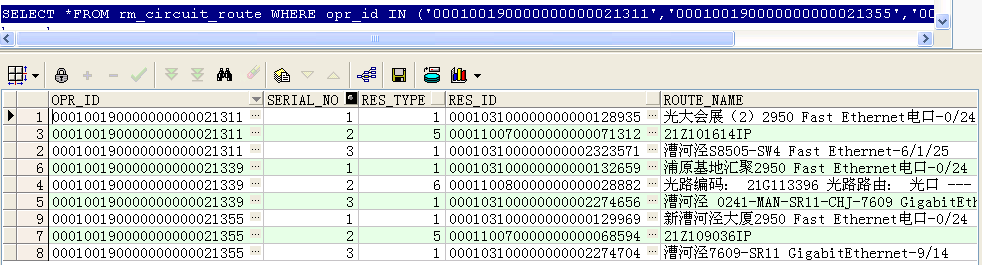
–找出这三条电路每条电路的第一条记录类型和最后一条记录类型
SELECT opr_id,res_type,
first_value(res_type) over(PARTITION BY opr_id ORDER BY res_type) low,
last_value(res_type) over(PARTITION BY opr_id ORDER BY res_type rows BETWEEN unbounded preceding AND unbounded following) high
FROM rm_circuit_route
WHERE opr_id IN (‘000100190000000000021311′,’000100190000000000021355′,’000100190000000000021339’)
ORDER BY opr_id;
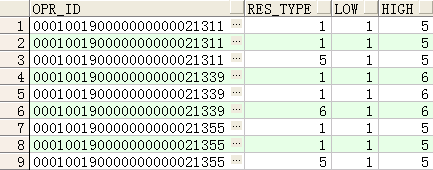
注:rows BETWEEN unbounded preceding AND unbounded following 的使用
–取last_value时不使用rows BETWEEN unbounded preceding AND unbounded following的结果
SELECT opr_id,res_type,
first_value(res_type) over(PARTITION BY opr_id ORDER BY res_type) low,
last_value(res_type) over(PARTITION BY opr_id ORDER BY res_type) high
FROM rm_circuit_route
WHERE opr_id IN (‘000100190000000000021311′,’000100190000000000021355′,’000100190000000000021339’)
ORDER BY opr_id;
如下图可以看到,如果不使用
rows BETWEEN unbounded preceding AND unbounded following,取出的last_value由于与res_type进行进行排列,因此取出的电路的最后一行记录的类型就不是按照电路的范围提取了,而是以res_type为范围进行提取了。
–lag() over()函数用法(取出前n行数据) lag(expresstion,<offset>,<default>)
with a as
(select 1 id,’a’ name from dual
union
select 2 id,’b’ name from dual
union
select 3 id,’c’ name from dual
union
select 4 id,’d’ name from dual
union
select 5 id,’e’ name from dual
)
select id,name,lag(id,1,”)over(order by name) from a;
–lead() over()函数用法(取出后N行数据)
lead(expresstion,<offset>,<default>)
with a as
(select 1 id,’a’ name from dual
union
select 2 id,’b’ name from dual
union
select 3 id,’c’ name from dual
union
select 4 id,’d’ name from dual
union
select 5 id,’e’ name from dual
)
select id,name,lead(id,1,”)over(order by name) from a;
–ratio_to_report(a)函数用法 Ratio_to_report() 括号中就是分子,over() 括号中就是分母
with a as (select 1 a from dual
union all
select 1 a from dual
union all
select 1 a from dual
union all
select 2 a from dual
union all
select 3 a from dual
union all
select 4 a from dual
union all
select 4 a from dual
union all
select 5 a from dual
)
select a, ratio_to_report(a)over(partition by a) b from a
order by a;
with a as (select 1 a from dual
union all
select 1 a from dual
union all
select 1 a from dual
union all
select 2 a from dual
union all
select 3 a from dual
union all
select 4 a from dual
union all
select 4 a from dual
union all
select 5 a from dual
)
select a, ratio_to_report(a)over() b from a –分母缺省就是整个占比
order by a;
with a as (select 1 a from dual
union all
select 1 a from dual
union all
select 1 a from dual
union all
select 2 a from dual
union all
select 3 a from dual
union all
select 4 a from dual
union all
select 4 a from dual
union all
select 5 a from dual
)
select a, ratio_to_report(a)over() b from a
group by a order by a;–分组后的占比
percent_rank用法
计算方法:所在组排名序号-1除以该组所有的行数-1,如下所示自己计算的pr1与通过percent_rank函数得到的值是一样的:
SELECT a.deptno,
a.ename,
a.sal,
a.r,
b.n,
(a.r-1)/(n-1) pr1,
percent_rank() over(PARTITION BY a.deptno ORDER BY a.sal) pr2
FROM (SELECT deptno,
ename,
sal,
rank() over(PARTITION BY deptno ORDER BY sal) r –计算出在组中的排名序号
FROM emp
ORDER BY deptno, sal) a,
(SELECT deptno, COUNT(1) n FROM emp GROUP BY deptno) b –按部门计算每个部门的所有成员数
WHERE a.deptno = b.deptno;
cume_dist函数
计算方法:所在组排名序号除以该组所有的行数,但是如果存在并列情况,则需加上并列的个数-1,
如下所示自己计算的pr1与通过percent_rank函数得到的值是一样的:
SELECT a.deptno,
a.ename,
a.sal,
a.r,
b.n,
c.rn,
(a.r + c.rn – 1) / n pr1,
cume_dist() over(PARTITION BY a.deptno ORDER BY a.sal) pr2
FROM (SELECT deptno,
ename,
sal,
rank() over(PARTITION BY deptno ORDER BY sal) r
FROM emp
ORDER BY deptno, sal) a,
(SELECT deptno, COUNT(1) n FROM emp GROUP BY deptno) b,
(SELECT deptno, r, COUNT(1) rn,sal
FROM (SELECT deptno,sal,
rank() over(PARTITION BY deptno ORDER BY sal) r
FROM emp)
GROUP BY deptno, r,sal
ORDER BY deptno) c –c表就是为了得到每个部门员工工资的一样的个数
WHERE a.deptno = b.deptno
AND a.deptno = c.deptno(+)
AND a.sal = c.sal;
percentile_cont函数
含义:输入一个百分比(该百分比就是按照percent_rank函数计算的值),返回该百分比位置的平均值
如下,输入百分比为0.7,因为0.7介于0.6和0.8之间,因此返回的结果就是0.6对应的sal的1500加上0.8对应的sal的1600平均
SELECT ename,
sal,
deptno,
percentile_cont(0.7) within GROUP(ORDER BY sal) over(PARTITION BY deptno) “Percentile_Cont”,
percent_rank() over(PARTITION BY deptno ORDER BY sal) “Percent_Rank”
FROM emp
WHERE deptno IN (30, 60);
若输入的百分比为0.6,则直接0.6对应的sal值,即1500
SELECT ename,
sal,
deptno,
percentile_cont(0.6) within GROUP(ORDER BY sal) over(PARTITION BY deptno) “Percentile_Cont”,
percent_rank() over(PARTITION BY deptno ORDER BY sal) “Percent_Rank”
FROM emp
WHERE deptno IN (30, 60);
SELECT ename,
sal,
deptno,
percentile_disc(0.7) within GROUP(ORDER BY sal) over(PARTITION BY deptno) “Percentile_Disc”,
cume_dist() over(PARTITION BY deptno ORDER BY sal) “Cume_Dist”
FROM emp
WHERE deptno IN (30, 60);
HTTP(HyperText Transfer Protocol)即超文本传输协议,所有的WWW文件都必须遵守这个标准。设计HTTP最初的目的是为了提供一种发布和接收HTML页面的方法。HTTP协议采用了请求/响应模型,浏览器或其他客户端发出请求,服务器给与响应。HTTP header 大体分为Request和Response两部分。
var sum = function () {
  var result = 0, i=0;
  for (i=0; i < arguments.length; i++) {
    result = result + arguments[i];
  }
  return result;
};
console.log( sum(0,1,1,2,3,5,8));  // 20